In today’s shifting economic environment, understanding the yield curve—and how it affects certificate of deposit (CD) rates—can help savers make more informed decisions. The yield curve not only reflects market expectations but also directly influences how financial institutions price and structure their CD offerings.
What Is the Yield Curve?
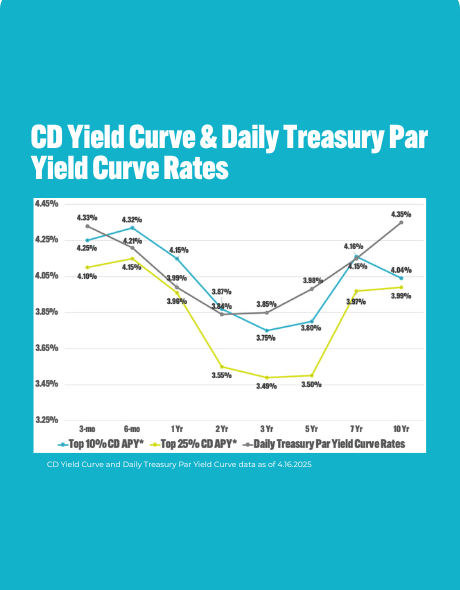
The yield curve is a visual representation of interest rates over different time horizons, typically for U.S. Treasury securities. It plots yield (return) on the vertical axis and maturity (time) on the horizontal axis.
Under normal conditions, the curve slopes upward: the longer you commit your funds, the more interest you earn. This makes up for inflation risk and economic uncertainty. However, the curve can flatten or even invert when short-term rates exceed long-term ones—often signaling expectations of slower economic growth or rate cuts ahead.
Yield Curve and the Current Economic Climate
Today’s economic outlook is shaped by looming inflation concerns, Federal Reserve policy decisions, and signs of slowing growth. While inflation has cooled down, it remains a top concern for policymakers. The Federal Reserve’s actions—especially potential rate cuts—usually affect short-term rates more than long-term ones.
Currently, the yield curve remains inverted. Shorter-term Treasury yields are higher than longer-term ones, reflecting market expectations of future rate cuts and a potential economic slowdown. In response, banks are offering higher rates on short-term CDs to stay competitive, making those products more attractive in the near term.
What the Yield Curve Means for CD Rates Today
CD rates often reflect the shape of the yield curve:
- When the curve is inverted, as it is today, short-term CDs (such as 6- or 12-month terms) often come with higher yields than long-term CDs.
- Longer-term CDs, in contrast, may not offer as competitive of rates since banks are cautious about locking in higher yields when rate declines are in the forecast.
As of April 15, CD Valet data shows that the top 10% of 12-month CD rates are 4.15% APY* or higher, with some institutions offering up to 5.11% APY*. Meanwhile, longer-term rates such as 60-month CDs are 3.80% APY*, with the top rate reaching up to 4.50% APY*.
This makes it essential to align your CD strategy with both your financial goals and your rate outlook. For some, locking in a longer-term CD now could provide protection against falling rates. Others may prefer to maintain flexibility and liquidity through shorter-term CDs or laddering.
Long vs. Short-Term: A 24-Month Comparison
To see how this plays out, let’s compare two CD strategies over a 24-month period. In one scenario, we will apply economists are correct in predicting rate decreases of 50 basis points by the end of 2025 and again by the end of 2026.
Scenario A: 24-month CD at 4.05% APY*
- Starting with $10,000, you’d earn about $827 in interest, ending with $10,827.
Scenario B: Four back-to-back 6-month CDs
- Starting at 4.20% APY* and renewing at lower rates as they drop by 50 basis points each year, you’d earn around $765 in total interest, ending with $10,765.
Even though short-term CDs currently offer slightly higher rates, if interest rates decline as projected, the 24-month CD opened today could generate more interest over the full term. That’s the value of locking in a solid, longer-term, predictable rate.
*Annual Percentage Yields (APY) not offered by CD Valet but based on data from various institutions as of 4/15/25 and subject to change. Early withdrawal penalty may apply. Fees may reduce earnings. Additional restrictions may apply.